
Recorded fuel
Active tickets and liters by actual fill date, with a monthly breakdown.
Bring together indicators from enabled applications in a dashboard that respects each user's permissions.
Public demo without registration. Clients: sign in to the application.
 Explore the product
The common problemPreparing manual reports before every meeting and repeating searches across applications.
With Kunjuk AnalyticsFilter the period, check activity by application and download information for analysis in Excel.
Who it is forManagement, administration and responsible users needing a view across enabled applications.
Your team can explore indicators from enabled applications and review context before deciding the next step.
Discover how it works: AnalyticsActive tickets and liters by actual fill date, with a monthly breakdown.
Currently active vehicles and work recorded during the period, with their recorded costs.
Visible warehouses, balances to replenish and movement counts by type.
Assets by status, assignments and overdue returns in the user’s workspace.
Personnel-record counts, receipt publications and views, available only to the client administrator.
Export indicators, chart values, dates and scope to an .xlsx file.
The pilot includes predefined indicators and bar charts. It only queries enabled applications and existing permissions. Fuel includes current transcribed receipts; inventory and asset data show the current state rather than a historical reconstruction. It does not include salary amounts, accounting reports, external integrations or forecasts.
An interactive workflow with fictional data. Explore, perform an action and see its result. This public simulation does not change the panel or save data.
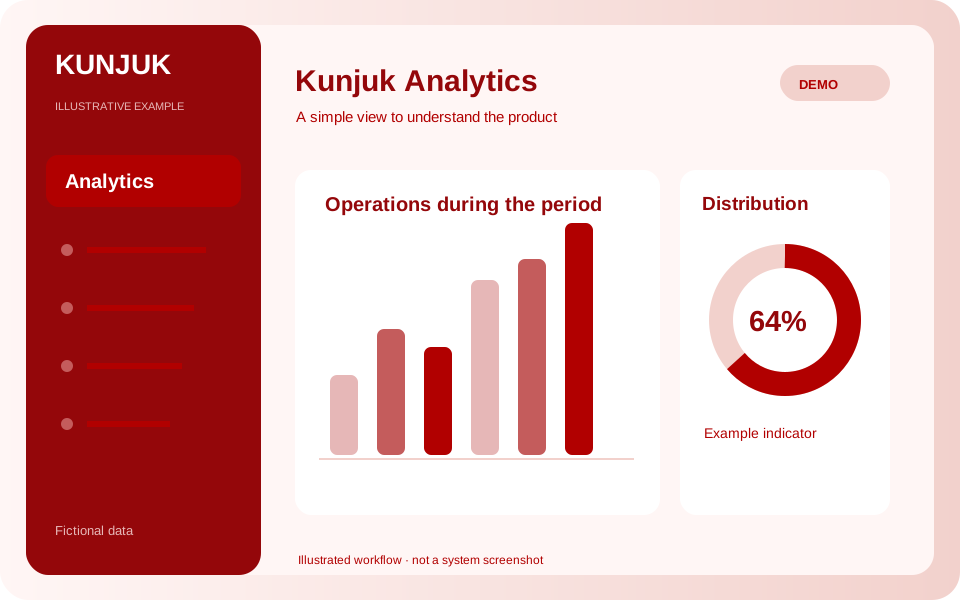
Select a chart bar to explore that application and its share of the total.
Select a bar to see details.
Enable the applications you need according to your package. Each organization keeps separate data, users and permissions.
Customize access with your logo and colors. You can also request a custom domain. We help define scope, implementation and access.
Explore the other applicationsTell us what you need to organize. We review the workflow together and define applications, implementation, training and support in a proposal.
Start with the tools your organization needs and expand later. Scope and conditions are defined in the commercial proposal.
Illustrative examples and public demos use fictional data. The interactive demo is a guided simulation of features without access to panel data.
Access depends on roles and permissions. A personalized demonstration reviews what each member should record, approve or view.